![]()
Part 1 Principles
1. Fluorescence microscope
2. Filterset
in FL-Mic
3. How concocal differs?
4.
What is confocal?
5.
Resolution in confocal
6. Optical
sectioning
7. Confocal image formation
and
time resolution
8. SNR in
confocal
9.
Variations of confocal
microscope
10. Special features from
Leica sp2 confocal
![]()
Part 2
Application
1. Introduction
2.
Tomographic view
(Microscopical CT)
3. Three-D reconstruction
4. Thick specimen
5. Physiological study
6.
Fluorescence detecting
General
consideration
Multi-channel detecting
Background correction
Cross-talk correction
Cross excitation
Cross emission
Unwanted FRET
![]()
Part
3 Operation and
Optimization
1.
Getting started
2. Settings in detail
Laser line
selection
Laser intensity and
AOTF control
Beam
splitter
PMT gain and offset
Scan
speed
Scan format, Zoom
and Resolution
Frame average, and
Frame accumulation
Pinhole and Z-resolution
Emission collecting rang
and Sequential scan
![]()
When Do
you need confocal?
FAQ
Are
you abusing
confocal?
Confocal Microscopy tutorial
Part 3 operation, optimization of Leica SP2 LSCM
![]()
Emission collection and Spectral detector adjustment
Leica SP confocal system has an unique emission filter-free spectral detecting system as detailed in section 9 of part 1 of this tutorial.
In the software user interface, the spectral detecting control looks like below:
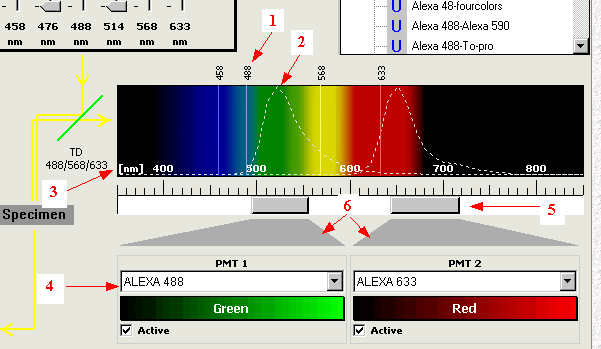
1. selected
laser lines. 2. reference curve for emission
spectra. 3. spectra scale.
4. list of reference curve.
5. spectra adjusting slider.
6. linkage to active PMTs.
Under the spectral scale, for each detecting channel, there is a slider for adjusting emission detecting position and range. Drag and move the slide to change its position, mouse-click on one edge of the slider, hold and drag to widen or narrow its width. Or double-click the slider to bring a dialogue, enter numerical value of starting and ending points for the detecting position and band width. This provides a versatile control on emission collection: virtually any position and range within visible spectra: 400 to 750 nm. The curve (2) here is not a setting of parameter but serves as a reference for slider adjusting. There are many curves in the list (4) to for you to choose from.
Practical tips for emission collecting slider adjusting:
-
Set the range of collecting according to the reference curve, try to avoid cross-emission as much as possible.
-
position the slider at least 5-15 nm after the excitation laser line to avoid collecting the laser light itself. The longer the laser wavelength, the farther the slider is away from the laser peak value. Ex. for blue lines 458-488: 5nm after; for green lines 514-568: 10 nm after; for red line 633: 15 nm after.
An interesting experiment result from me by using a mirror-slide on microscope stage, a neutral BSP 30/70 to collect laser directly shows the "diffusing" effect of different laser wavelength.
Laser source peak position range collected
(end at 10% of peak value)458 nm 456,5 nm 451-463 nm 476 nm 477,5 nm 471-483 nm 488 nm 488,2 nm 481-497 nm 514 nm 513 nm 506-522 nm 568 nm 568 nm 560-580 nm 633 nm 633,9 nm 623-648 nm
Spectral data of Emission peak in table 1 below can be used as reference numerical values for setting slider position and range.
Table 1. Fluorophore Spectral data and corresponding laser for Excitation (PDF)
| Fluorophore | Ex peak | Percent Peak value for individual laser1 | Em peak | |||||
| Peak (20% range)2 | 458 | 476 | 488 | 514 | 568 | 633 | Peak (20% range)2 | |
| SYTOX blue | 445 (405-464) | 48,9 | 1,9 | 0 | 0 | 0 | 0 | 470 (450-527) |
| BoBo-1 | 461 (410-486) | 97,1 | 49 | 17,9 | 8 | 0 | 0 | 484 (465-555) |
| PI | 538 (450-590) | 24,59 | 40,73 | 54,88 | 88,59 | 61,59 | 8,05 | 603 (576-668) |
| FITC | 495 (450-517) | 35,3 | 56,4 | 88 | 28,7 | 0 | 0 | 519 (497-575) |
| Alexa 488 | 499 (457-522) | 21,93 | 45,45 | 75,18 | 49,37 | 0 | 0 | 520 (497-572) |
| Oregon Green | 513 (466-533) | 12,47 | 33,63 | 41,78 | 99,38 | 0 | 0 | 533 (511-587) |
| TRITC / TMRho | 552 (500-577) | 2,21 | 5,8 | 10,47 | 33,19 | 51,77 | 0 | 578 (552-640) |
| Alexa 568 | 577 (519-600) | 1,24 | 2,72 | 5,42 | 15 | 85,53 | 0 | 603 (576-668) |
| Texas Red | 595 (537-623) | 0 | 0 | 0,64 | 5,78 | 35,32 | 7,06 | 613 (590-674) |
| Cy5 | 648 (583-673) | 0 | 0 | 0 | 0 | 10 | 63 | 665 (642-700) |
| Alexa 610-R-PE | 567 (470-584) | 12,31 | 28,51 | 51,97 | 46,95 | 99,16 | 4,94 | 627 (580-665) |
| Alexa 647-R-PE | 568 (470-674) | 10,26 | 26,29 | 48,65 | 45,72 | 100 | 29,03 | 666 (641-700) |
| Alexa 660 | 663 (538-700) | 2,55 | 4 | 5,74 | 11,41 | 35,68 | 71,07 | 691 (660-730) |
| Alexa 680 | 679 (580-716) | 1,3 | 1,57 | 1,95 | 3,51 | 15,58 | 55,82 | 702 (672-740) |
| ECFP | 430 (380*-477) | 68 | 21 | 8 | 0 | 0 | 0 | 474 (450-550) |
| EGFP | 494 (420-518) | 57 | 80 | 96 | 36 | 0 | 0 | 510 (490*-564) |
| EYFP | 520 (475-531*) | 8 | 23 | 35 | 95 | 0 | 0 | 535 (513-590) |
| DsRed | 553 (457-577) | 21 | 36 | 40 | 64 | 58 | 0 | 585 (558-653) |
Note:
1. The percentage in table 1 should not be used as the
setting for AOTF percentage (as more than one user asked). They speak totally
different things. value in table 1 indicate the percent of fluorophore excited
under one laser line. AOTF percentage means the percent of light from
laser source delivered to the specimen. Maybe, the low value in table 1 implies
you have to use high AOTF percentage and vice versa.
2. The range in parenthesis indicates the 20% boundary on both side, at that
wavelength, the intensity drop to 20% of its peak value. Value with * means
until there, it has not dropped below 20%, further data is not available.
Sequential scan:
In multiple fluorescence labeled specimen, some times, meeting above two criteria reduces signal intensity significantly. If that become intolerable, sequential scan has to be used to collect wider range, where you don't need worry about collecting into next fluorophore' excitation laser or overlapped emission field.
Sequential scan is a must-be choice if the detecting channels (number of PMTs) are fewer than fluorophores in your specimen.
Follow steps below to work with it:
-
Optimize individual detecting channels you are use, one by one, including parameters for:
Laser line and its intensity by AOTF.
Beam-splitter
PMT and LUT for the channel
Emission collecting range (it can be much wider then simultaneous scan)
Number of average -
Save the settings separately under user setting list
-
Check sequential scan check box, which brings a sequential settings list box for holding those saved parameters.
-
Drag all the saved settings from user setting to the list box, or use add button to do the same. Finally save this settings as new item, which can be loaded and re-used in the future.
-
In the sequential scan mode box, choose either between line, frame or stacks.
-
Click either single scan or series scan to start data acquisition.
![]()
Statement about this web and
tutorial.
For problems or questions regarding this web contact
e-mail:
This page was last updated 23.03.2004